Tools to Assist Financial Astrology

Contents
The following tools within Solar Fire may be helpful when dealing with financial matters.
•Transits to First Trade Charts - either via a dynamic report or the graphic ephemeris
See Generating a Dynamic Report and Using the Graphic Ephemeris.
•The Calendar is useful for planetary daily aspects and exact time of culmination (Intraday Traders). All the planets are significant but the faster moving ones have more impact on a daily basis, especially the MOON.
See Using Calendars.
•Using the Real Time Clock to watch planets rise, culminate and set as you trade (Intraday Traders).
See Real Time Clock and Animation.
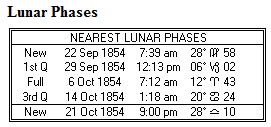
•The Moon and Lunar Phases are very important in financial astrology. Overall, studies and statistics show that the waxing phase of the cycle is more bullish compared to the bearish waning phase - however each stock has an inherent natal lunar cycle. The Lunar Phases page object may be useful to use on a chart page.
See Editing a Page Design File for help putting this object on any page you would like it on.
You can view similar lunar phase data on a chart Report Tabulation. See Viewing Reports or Tabulations for a Single Chart - select the Tabulations tab, then the "Phases/Eclipses" tabulation.
Also see Casting a Lunar Phase or Eclipse Chart for casting all kinds of lunar phase/return charts etc for a company.
•Using a 90 degree dial to quickly see hard (8th harmonic) aspects.
•Changing from Geocentric to Heliocentric charts and graphs. Both kind of charts are used by traders - when plotted graphically, one is smooth and one isn't. This is determined when casting a chart; select "Heliocentric" or "Geocentric" as the coordinate system on the New Chart Data Entry screen.
You can also generate you own geocentric or heliocentric ephemeris with the Ephemeris Generator, and then export the ephemeris as a MS Excel format file. Any spreadsheet program that can read Excel files will be able to open this file, which you can use for further research and analysis of planetary conditions and movements as they relate to trading.
See Generating an Ephemeris Listing for help with doing that.
•WD Gann was a finance trader who developed the technical financial analysis tools known as Gann angles, Square of 9, Hexagon, Circle of 360. One of his techniques utilized Planetary Returns.
See Casting a Return, Ingress or Transit Chart for help casting a Planetary Return Chart.
•Fluctuations in individual planetary Declination, or the combination of differing planetary declinations, may reflect corresponding fluctuations in financial markets. Thus it may be useful to keep an eye on the declinations of the transiting planets. You can view a Declination Strip object and a Tabulation on a Reports page, or use the Graphic Ephemeris with Declination as the coordinate you are interested in using on the graph.
See Using the Graphic Ephemeris for a declination graph, and Viewing Reports or Tabulations for a Single Chart to see how to view tabulations. The particular tabulation you want is called "Declinations" in the "Tabulations" tab of the "Chart Reports and Tabulations" window.
•Via their impact, Eclipses (which astronomically are related to the Moon and Sun's declination) and the various Saros cycles they occur in, can reflect market swings.
See Searching for Eclipses and Casting a Lunar Phase or Eclipse Chart to see eclipse data. Additionally you can switch on eclipses for any Dynamic Report, include eclipse points in a Extra Ring Points file for use around a Natal or Event Chart, or in a User Defined Points file for use alongside the normal Displayed Points in a chart. You can also view eclipse data in a chart's Report Tabulations in the "Phases/Eclipses" tabulation.
•Synastry grids for the trader's natal chart and the Company chart of the company whose stock they are trading in (or between the trader's chart and the company's First Trade chart) can be used to see how compatible or incompatible the two charts may be.
See Displaying or Printing a Synastry Grid.
•Graphic Ephemeris for displaying financial data. If for instance you are able to download financial data for the year from a stock market you may be able to display that data on a Graphic Ephemeris showing your transits for (say) a year, comparing the financial movements with your transits.
>> To plot financial data on a Graphic Ephemeris
1.In the Main Screen click on the Dynamic menu, then click on Graphic Ephemeris.
2.Click on the Import Financial Data button. This launches a File dialog window where you can navigate to a folder and select a file containing the financial data.
The file should be in the comma separated value format (.csv) which contains rows of data, each row containing fields of information separated by commas. The first row should not contain data, but instead should contain names for the different fields. Then all subsequent rows contain financial data.
Numeric data is written as it is, textual data is generally surrounded by double quotes (12,"text data",1,0).
TIP: Microsoft Excel can read CSV files and display the data as rows and columns (fields). If you need to check your data before importing it this may be a handy option for you. You could also use it to manually add field names in the first row if you needed to by inserting a new spreadsheet row above the top row of financial data if necessary to create a blank row, and then typing in the name for each column in the top blank row.
3.If Solar Fire cannot understand the data in the file you have selected you will see this screen:

Cannot use data in Financial File
4.If Solar Fire can understand the data in the file you have selected you will see a screen like this:

Finacial data being imported into Solar Fire
The options on this screen include:
Selecting or de-selecting columns of data to display in the ephemeris by clicking on the column headers until you have the result you want. The columns that will be displayed are written above the data.
Using the Pick the Date Column button to pick a column with date information (in case Solar Fire has selected the wrong column – usually it detects the first one with dates).
•Choose a range of rows to use – these numbers default to all the rows in the file, but you can enter your preferred starting and ending row if you wish.
•Base the minimum and maximum of the graphing on all columns, or on a particular data column.
•Display a Vertical Scale – this is checked by default, and means that there will be numbers representing key segments in the total scale of the financial data numbers (from the lowest to the highest), displayed next to the astrological angles on the vertical axis in the Graphic Ephemeris
5.Clicking the Import button sets this data to be used whenever the ephemeris is displayed. You are then returned to the "Graphic Ephemeris Selection" screen, and can click View to see the ephemeris. The display looks like this:

Financial data in the Graphic Ephemeris
The financial data’s scale is shown on the left – from 33 at the 40-degree line up to 126 at the 0-degree line.
NOTE: Using this facility you can potentially plot non-financial data in an ephemeris like this. The key thing is to have date based data in the file - the numerical data itself can relate to any topic that interests you. By experimenting with different sets of data in the file you import you may be able to successfully apply this graphing functionality to another field of interest.