Working with the Results of a Chart Search
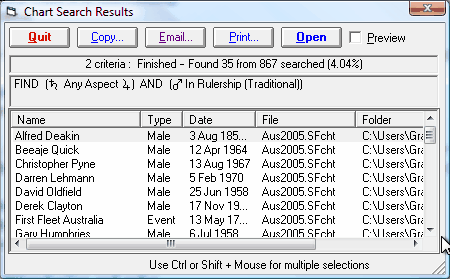
When the Chart Search starts running, the "Chart Search Results" dialog appears.

As the search progresses, the top caption shows the progress, indicating how many matching charts have been found, how many have been searched, and what percentage of those searches have resulted in matches.
Each matching chart that is found is added to the main list below, as it is found.
>> To stop the search while it is still running.
•Click on the Stop button.
After the search has been stopped, or finishes on its own, the caption on the "Stop" button changes to "Quit".
>> To preview charts in the results list
•Click on the Preview checkbox to toggle it on or off.
When it is checked, whenever you click on a chart in the results list, the chart preview window will be displayed or updated with the currently highlighted chart. The Chart preview window may be moved and re-sized according to your preferences.
>> To resize the width of a column
•Use the mouse to drag the column border between any two column headers
or...
•Double-click on a column border to make the column automatically resize to fit the largest item of data that is displayed in that column.
>> To edit the column selection and order
•Use a right hand mouse click when the cursor is over the column headers.
This will display the "Choose Columns" dialog.
You can select or unselect any of the available columns by either clicking in the checkbox to the left of the column name, or by using the Show or Hide buttons.
You can change the order of a column by highlighting it and then using the Move Up or Move Down buttons to re-order it relative to the other columns.
Note: If the selected columns’ widths are cumulatively wider than the displayed width of the list, a horizontal scroll bar will appear at the bottom of the list, allowing you to scroll to see the extra columns. Alternatively you can increase the displayed width of the list by resizing the width of the entire dialog.
>> To copy selected charts from the results list into another chart file
1.Select the required charts (use Ctrl or Shift + Mouse to make multiple selections).
2.Click on the Copy button. This will display the "File Manager" with a list of target chart files.
3.Either select one of the files on the list, or select the Create button to create a new empty chart file to copy the charts into.
A "Copy Charts" dialog box will be displayed, giving the options of copying all of the selected charts without confirmation, of being asked for confirmation of the copying of each individual chart, or of canceling the copying process. If the Yes button is selected then, for each selected chart in sequence, a dialog box will be displayed asking whether or not that individual chart should be copied. If the No button is selected then all of the selected charts will be copied immediately. If the Cancel button is selected then no charts are copied.
Note that when charts are copied to another chart file, any chart comments and events that are associated with the charts are copied as well, provided that the destination chart file is of a format that can store these.
>> To email charts in the results file
•Select the Email button and from the drop-down menu select either the All Charts… option or the Selected Charts… option.
You will then see the Email Charts dialog with various options for sending the charts by email. See ??? for more information about this dialog.
>> To print a chart details summary of charts from the results list
The summary may be printed at three different levels of detail...
•"Brief Listing" - Each chart occupies a single line of output, and contains only the essential details that would be required to recast the chart: Name, date, time, timezone, latitude and longitude.
•"Full Listing" - Each chart occupies two lines of output, and contains the same information as the brief listing plus the coordinate system (geocentric/heliocentric), zodiac type, house system, place name and country/state.
•"Full with Comments" - The details of each chart occupy two lines of output, containing the same information as the full listing, and any chart comments that are associated with the chart occupy additional text lines below the chart details.
1.Select the Print button and from the drop-down menu select either the All Charts… or Selected Charts… option.
2.Select the Print button again and from the drop-down menu select one of the listing options Brief Listing, Full Listing or Full with Comments.
3.The “Print” dialog box will appear, from which you can alter printer settings, add this job to the print queue, or print it immediately. See Printing from Solar Fire for further information on printing.
>> To open a selected chart in the Chart Database screen
•Double-click on the selected chart
Or...
1.Highlight the required chart by clicking on it.
2.Click on the Open button and choose the option to open the chart file.
>> To open selected charts and add them to the main list of "Calculated Charts"
1.Select the required chart or charts (use Ctrl or Shift + Mouse to make multiple selections).
2.Click on the Open button and choose the option to add the charts to the list of "Calculated Charts".
